What is Insurance Analytics Software: Complete Guide to AI-Powered Solutions

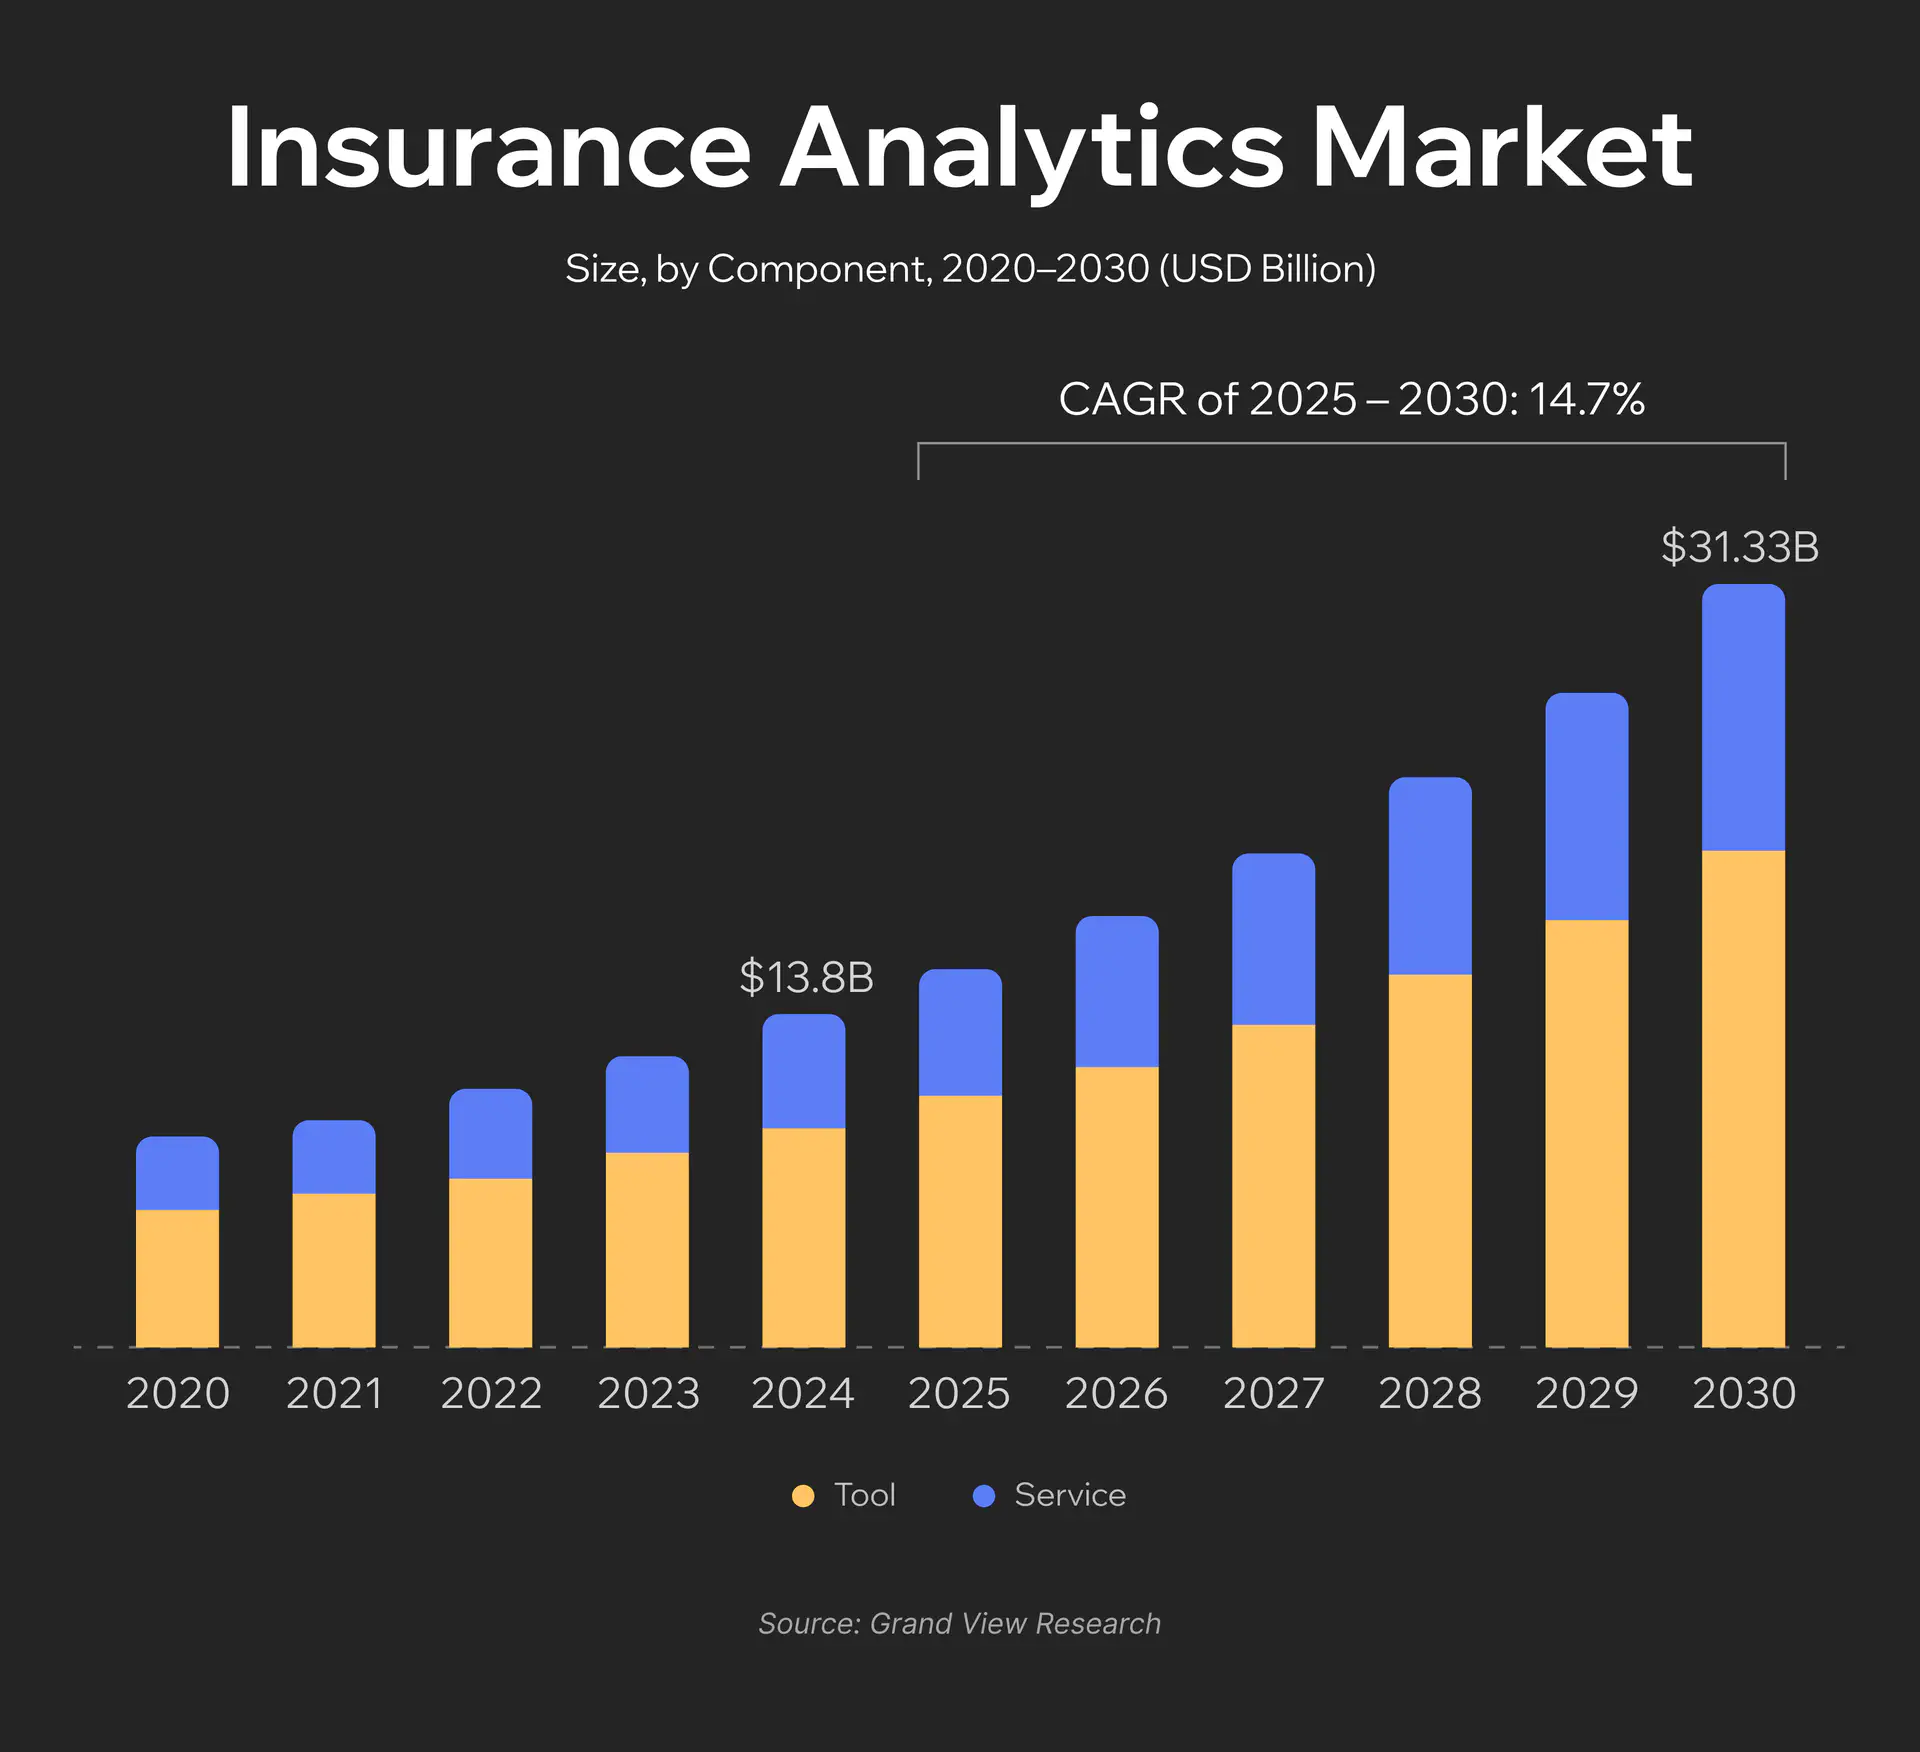
The global insurance analytics market was valued at $13.84 billion in 2024 and is projected to grow to $43.95 billion by 2030 according to Grand View Research. That’s nearly a threefold increase in six years. The reason is simple: insurance companies generate massive amounts of data, but most of it remains unused. Underwriters still rely on outdated actuarial tables, analysts spend weeks preparing reports that become obsolete before publication, and fraudsters adapt faster than companies can respond.
The scale of the problem is staggering: insurance fraud in the US costs over $40 billion annually, adding $400 to $700 to insurance premiums for every American family. In 2024, insurance fraud increased by 19% compared to the previous year, while attacks using synthetic voice technology surged by 475%.
Machine learning systems already assess risks more accurately than experienced underwriters, detect fraudulent schemes in seconds, and predict customer behavior with over 80% accuracy. According to Deloitte forecasts, implementing AI technologies in insurance claims processing could save insurers between $80 billion and $160 billion by 2032.
This article is a practical guide for those making decisions about implementing or upgrading analytics systems. We’ll examine how modern platforms work, which features are critically necessary, what’s more advantageous (buying or building your own solution), and which technologies will become the new industry standard in two to three years. For companies exploring custom insurance software development, understanding analytics capabilities is crucial for competitive advantage.
What is Insurance Analytics Software?
Insurance analytics software is a specialized platform that aggregates data from all insurance operations (sales, underwriting, claims, finance, customer interactions) and transforms it into actionable business decisions. Unlike traditional BI systems that simply visualize historical data through charts and tables, what is insurance analytics software at its core – it integrates artificial intelligence to predict risks and provide automated recommendations.
Three Types of Analytics
Descriptive Analytics (what happened?) is the foundational level that summarizes historical data and identifies patterns. An insurance company analyzes monthly claims data and sees that January and February bring a sharp increase in accidents on rural highways. Or that customers aged 25 to 35 more frequently cancel policies after the first year. This forms the foundation for understanding the business, but it doesn’t answer “why” or provide forecasts.
Predictive Analytics (what will happen?) uses historical data, statistical models, and machine learning to forecast future events. Predictive analytics insurance software can predict that a specific customer will file a claim within the next few months based on their profile, driving history, and external factors. Or that a certain region will have a specific percentage more claims due to changing weather patterns.
Prescriptive Analytics (what to do?) represents the most advanced level. The system doesn’t just forecast but recommends specific actions. After a car accident, it not only estimates damages but also details necessary repairs, recommends a specific auto shop with optimal price-to-quality ratio, suggests a negotiation strategy with the customer, and even predicts the likelihood of their satisfaction with different settlement scenarios.
Key Application Areas
- Underwriting optimization: algorithms analyze thousands of risk factors in seconds, offer personalized terms, and automatically approve standard applications.
- Claims management: from initial call to payout. Insurance claims analytics software estimates damage costs from photos, determines review priority, and coordinates surveyor work.
- Fraud detection: real-time anomaly detection, social graph analysis to find organized groups, document verification through computer vision.
- Risk assessment: dynamic risk evaluation accounting for changes in customer behavior, external factors, and macroeconomic conditions.
- Customer analytics: customer segmentation, churn prediction, offer personalization, and communication channel optimization.
How Insurance Analytics Software Works
Architecture of Modern Analytics Systems
A modern Insurance Analytics Platform consists of five interconnected layers, each performing specific functions:
- Data ingestion layer serves as the entry point for all data types. The system accepts both streaming data from IoT sensors in insured assets and batch uploads from legacy systems. Data flows into a Data Lake, where it’s stored in raw format for subsequent processing through ETL/ELT procedures.
- Data preprocessing layer is where transformation happens. The Data Warehouse structures information, eliminates duplicates, and standardizes formats. At this stage, customer data from CRM merges with geospatial information and meteorological forecasts.
- Data analysis layer is the system’s core. Here, algorithms perform retrospective analysis (what caused last quarter’s losses?), trend analysis (how is customer behavior changing?), root cause analysis (why did claims increase in a specific region?), scenario modeling, and forecasting.
- Intelligent decision-making layer is the most sophisticated component. AI models analyze results from the previous layer and generate recommendations. Results are stored in an Analytical Database for rapid access.
- Serving layer provides the business interface. From here, data flows to the Insurance Portal for customers, underwriting systems, CRM, accounting software, claims management platforms, HR systems, and FP&A tools.
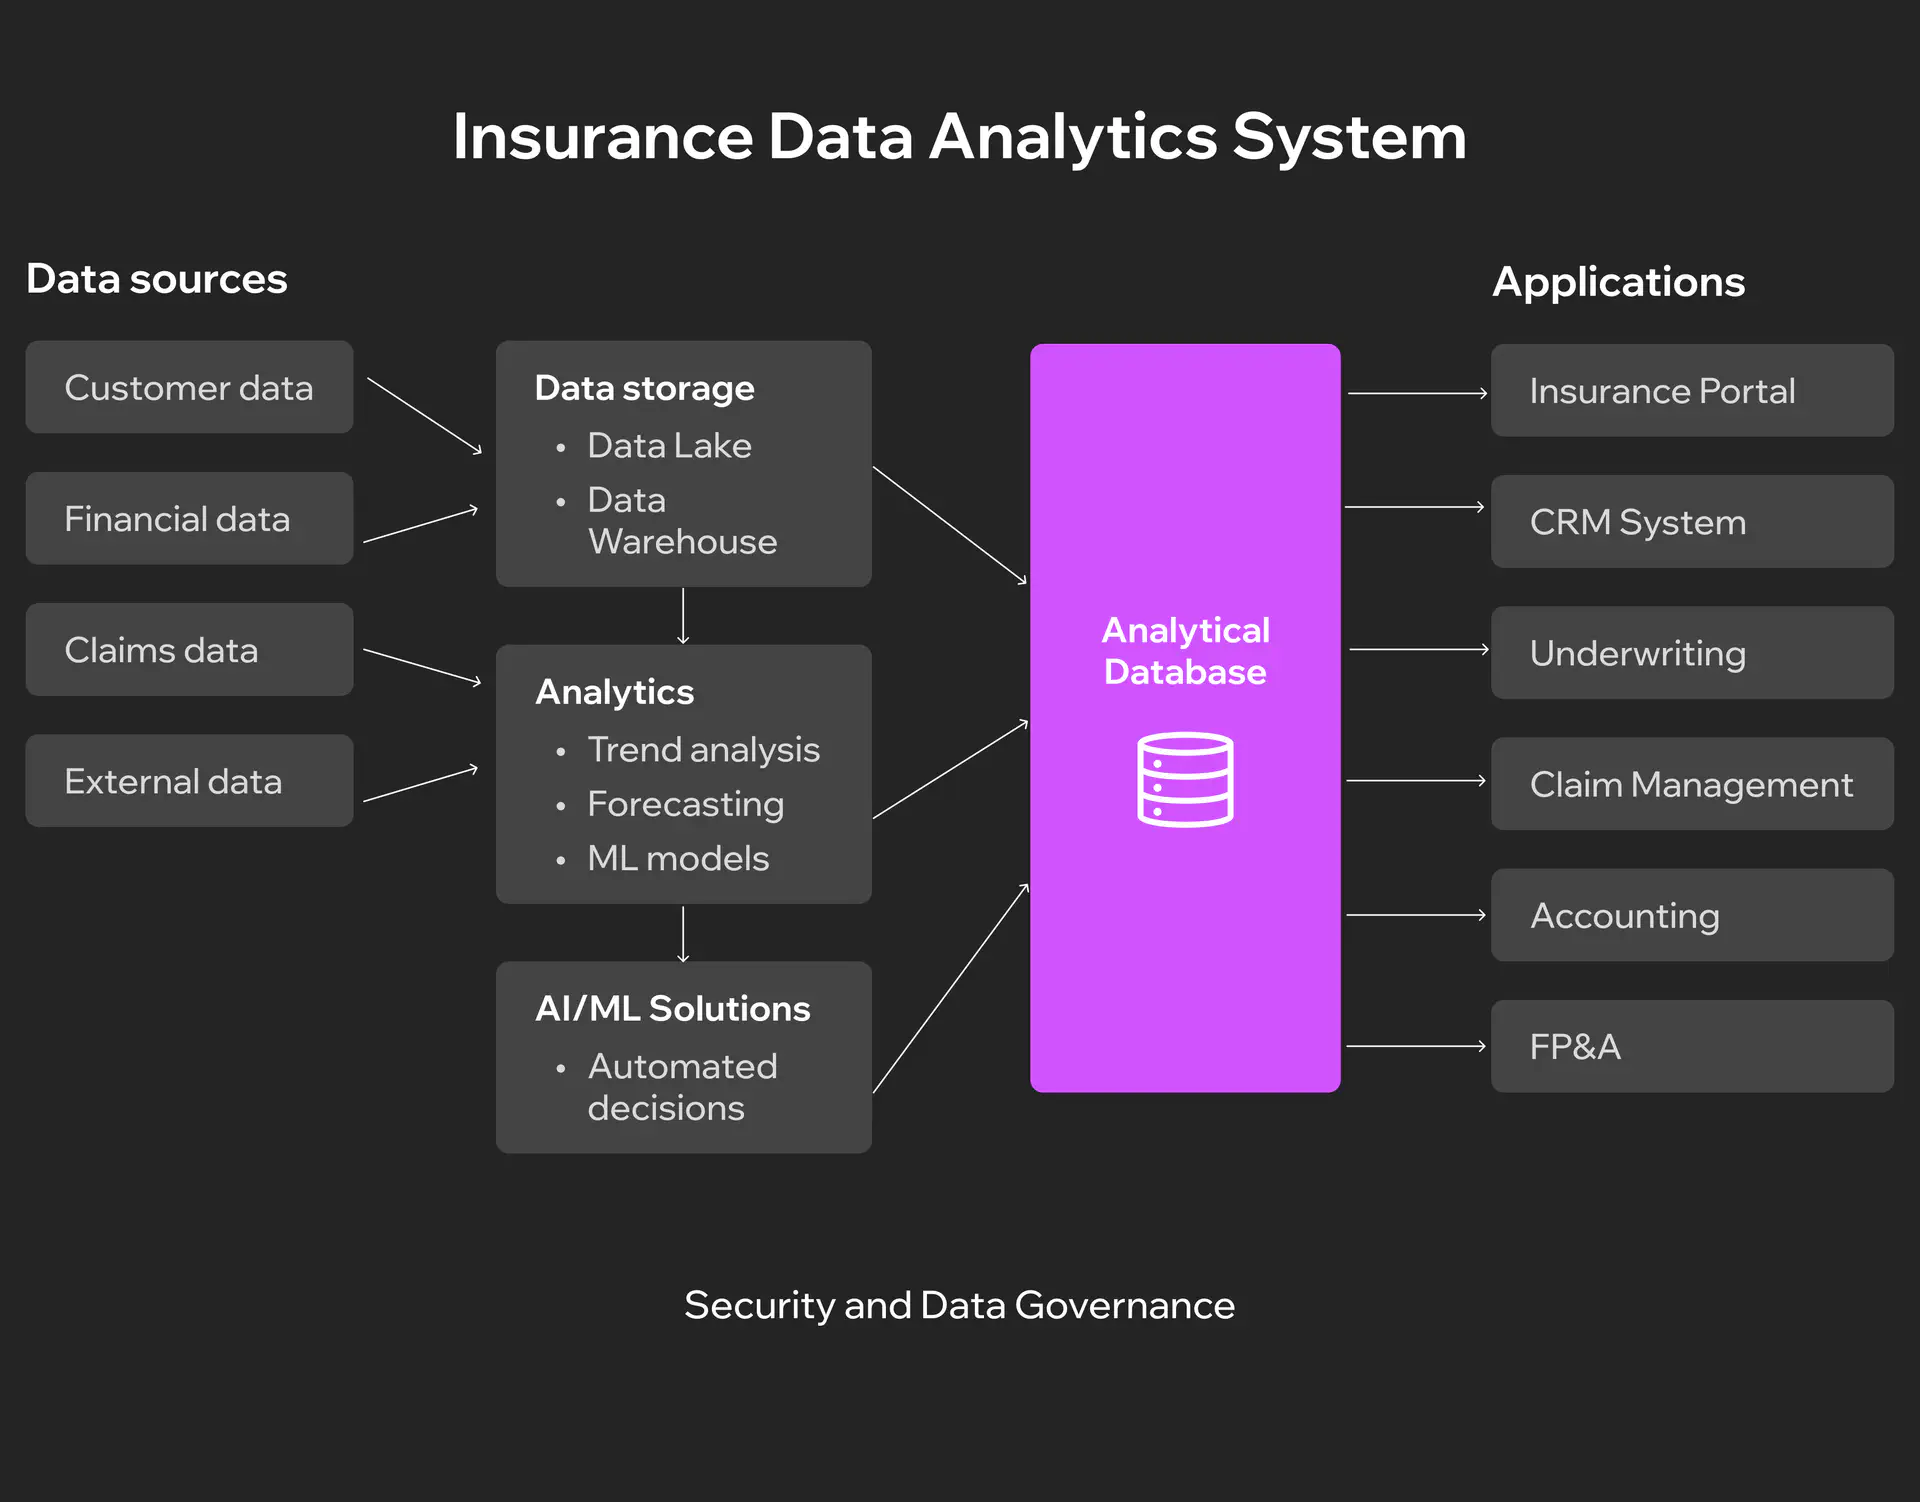
The critical difference between traditional BI and insurance analytics lies in the depth of operational integration. A BI system will show you that claims increased by N% last month. Insurance claims analytics software identifies specific causes of the increase, forecasts trends for the next three months, determines risk groups, and suggests rate adjustments for each segment. Insights arrive directly in the underwriter’s or adjuster’s working tools at the moment decisions are being made.
Technology Stack
Modern insurance analytics platforms are built on a combination of technologies, each addressing specific challenges of scale and processing speed.
Big Data technologies form the foundation for handling massive volumes of information. Apache Hadoop stores petabytes of unstructured data (scanned documents, damage photos, call recordings), while Apache Spark processes it significantly faster than traditional systems. Apache Kafka enables real-time data streaming: when a customer files a claim through a mobile app, the information instantly flows into the analytics system for processing.
Machine Learning frameworks transform data into predictions and recommendations. TensorFlow and PyTorch train neural networks to recognize fraudulent patterns, Scikit-learn builds risk assessment models, and XGBoost predicts the probability of claims occurring. Most importantly, these models continuously learn from new data, improving forecast accuracy each month. AI transforms insurtech by enabling real-time decision-making and personalized customer experiences.
Cloud infrastructure provides power and flexibility. AWS SageMaker or Azure Machine Learning allow training complex models without dedicated servers. Databricks combines data storage and processing in a unified platform, while Snowflake ensures fast access to analytics data for thousands of concurrent users. Cloud infrastructure automatically scales based on workload.
API integrations connect the analytics platform to the outside world. REST APIs receive data from partners and regulators, GraphQL provides flexible access to analytics data for internal systems. Integrations with mapping services enrich geospatial data, weather APIs add meteorological forecasts, and connections to credit bureaus enable verification of customers’ financial histories.
Working Scenario Example
Let’s examine a typical auto claim processing scenario to see how the system works from start to finish.
A customer has a car accident and reports it through a mobile app, uploading photos of the damage and automatically transmitting the incident’s geolocation. Data instantly flows into the analytics system via Kafka.
A computer vision model based on TensorFlow analyzes the photographs and identifies the nature of the damage: front bumper deformation, headlight damage, hood dents. Based on visual analysis, the system estimates repair costs. In parallel, a fraud detection algorithm checks multiple factors: the customer’s previous claims history, whether similar incidents occurred near this location, and whether the damage pattern matches the described accident circumstances. The system assigns the case a fraud risk level.
An NLP model processes the customer’s text description of the event, determining their emotional state and stress level. Based on this analysis, the system forecasts the likelihood of a conflict situation and recommends an appropriate communication style. Predictive analytics insurance software estimates expected repair time, considering auto shop availability in the region and parts accessibility.
When the adjuster opens the case, they see a complete picture: repair cost estimate, recommended settlement amount, list of verified auto shops nearby, ready-drafted customer communication. If the system detected elevated stress levels, a recommendation appears to call personally instead of sending an email. A decision that previously required several days of checks and approvals now takes mere minutes.
Integration with Existing Systems
Policy administration systems (Guidewire, Duck Creek) receive updated risk ratings to adjust premiums during policy renewals. The analytics platform sends pricing recommendations via REST API every 24 hours. If the ML model detects that a customer’s risk has decreased (installed a telematics device, had no claims for two years), the system automatically offers a discount upon contract renewal.
Claims management systems (ClaimCenter, Snapsheet) integrate bidirectionally. They transmit details of each claim for analysis and in return receive fraud scores, damage assessments, and prioritization recommendations. When the system detects a pattern of possible organized fraud (five claims from different people but with identical witnesses), it automatically flags all related cases for detailed investigation.
Customer relationship management (Salesforce, Microsoft Dynamics) is enriched with analytical insights. Before a call, the agent sees a churn prediction score (probability of policy non-renewal), personalized product recommendations, and optimal contact timing. If analytics show the customer is considering competitors (visited three price comparison sites), CRM automatically creates a task for the retention manager.
Must-Have Features
When choosing an insurance analytics platform, it’s crucial to understand which features are critically necessary and which are nice-to-have. Let’s examine the key capabilities without which a modern system simply cannot compete.
Core Analytics Capabilities
- Predictive modeling for underwriting assesses risks of new applications within seconds. The system analyzes hundreds of parameters and determines optimal policy pricing individually for each customer.
- Insurance claims analytics software operates in real time for fraud detection. Every claim automatically undergoes checks including comparison with historical patterns, analysis of inconsistencies, and verification of connections between participants.
- Risk scoring and segmentation create dynamic customer profiles based on continuously updated information such as driving behavior through telematics, credit history, and life events.
- Portfolio analysis reveals insurance portfolio health, showing which segments generate profit, where losses concentrate, and how risks are distributed.
Data Management
- Multi-source data integration combines information from dozens of sources including internal systems, external providers, IoT devices, and social networks.
- Data quality and governance guarantee analysis reliability through automatic validation, duplicate detection, and inconsistency identification.
- Real-time data processing handles events as they occur, including new claims, changes in driving behavior, and market condition updates.
- Historical data analysis stores years of transactional data to identify long-term trends and seasonal patterns.
Advanced Features
- AI/ML capabilities automate insights. Anomaly detection identifies unusual patterns without manual configuration. Automated insights analyze millions of combinations and highlight the most important correlations. Explainable AI clarifies the logic behind recommendations.
- Natural Language Processing handles claim descriptions, medical reports, and customer correspondence. It extracts key facts, classifies case complexity, and determines sentiment.
- Geospatial analytics visualizes risks on maps, showing claim concentrations, territories with elevated catastrophe risks, and exposure changes during expansion.
- IoT data integration opens the era of personalized insurance. Telematics reveals actual driving style, wearables capture health metrics, and smart home sensors detect risks before losses occur.
User Experience
- Intuitive dashboards provide quick access to key metrics. Each role sees relevant information with drill-down capability from high-level overviews to specific transaction details.
- Customizable reports adapt to specific business needs. Users create their own reports through drag-and-drop interfaces without IT assistance.
- Self-service analytics allow business users to independently explore data and create visualizations.
- Mobile accessibility ensures access at any moment for adjusters at incident scenes, sales agents during meetings, and executives between appointments.
Compliance and Security
- Regulatory compliance is embedded in the architecture, including GDPR controls, local regulations by country and state, and automatic compliance report generation for regulators.
- Data encryption and security protect at all levels through encryption at rest and in transit, multi-factor authentication, and regular security audits.
- Audit trails record every action, documenting who viewed which data when and what changes were made. Immutable logs cannot be altered post-factum.
- Role-based access control ensures the principle of least privilege. Each role sees only necessary data with automatic expiration of temporary access.
Build vs Buy vs Hybrid Approach
One of the toughest decisions when implementing analytics is whether to build your own system, buy a ready-made solution, or choose a hybrid approach. Each option has its advantages and limitations that critically impact implementation speed, costs, and the ability to adapt to specific business needs.
Criterion | Build (Custom Development) | Buy (Off-the-Shelf Solution) | Hybrid (Combined Approach) |
Initial cost | $500K-$2M+ | $50K-$300K annual license | $200K-$800K |
Time to market | 12-24+ months | 3-6 months | 6-12 months |
Customization | Complete flexibility for any requirements | Limited configuration within platform | Customization of critical components |
Maintenance | In-house team of 5-15 people | Vendor support + 1-2 internal | 3-7 people for custom components |
Scalability | Depends on architecture | Proven scalability | Depends on integration |
Innovation speed | Full control, but slower initially | Automatic vendor updates | Balance between control and speed |
Risk level | High (technical debt, talent dependency) | Low (vendor lock-in) | Medium |
Competitive advantage | Maximum differentiation through proprietary algorithms | Same tools as competitors | Strategic differentiation in key areas |
Best for | Large insurers with unique processes and long-term vision | Mid-size companies with standard needs | Companies with specific requirements for individual modules |
While off-the-shelf solutions offer quick deployment, they provide the same capabilities to all your competitors. When evaluating the best insurance analytics software for your needs, building a custom solution delivers the greatest competitive advantage through proprietary algorithms, unique data models, and processes tailored precisely to your business strategy. Yes, it requires higher initial investment and longer development time, but the result is a system that competitors cannot replicate and that evolves exactly as your business needs dictate.
For commercial insurance analytics software with specialized requirements, the hybrid approach is becoming increasingly popular as a pragmatic middle ground. Companies purchase a core platform for standard functionality (data ingestion, storage, basic analytics) while developing proprietary modules for differentiating capabilities (unique fraud detection algorithms, specialized underwriting models). This balances implementation speed with the ability to create competitive advantage through technology. Choosing the right insurance software development company is critical for successful custom implementation.
Ready to build a custom insurance analytics solution that gives you a real competitive edge?
Let’s discuss how we can create a system that perfectly fits your unique business requirements and strategic goals.
Request a conversationFuture Trends in Insurance Analytics
Generative AI Adoption
In 2025, the insurance industry is actively scaling artificial intelligence adoption. According to SAS, 89% of insurers plan to invest in generative AI, and 92% already have dedicated budgets for such projects. IBM forecasts that GenAI investments will grow by more than 300% from 2023 to 2025. Companies that have already implemented similar solutions report approximately 48% higher NPS, demonstrating the advantages of automated report generation, AI assistants, and intelligent decision support systems.
Real-Time Analytics and IoT
Demand for real-time analytics is growing rapidly. According to Mordor Intelligence forecasts, the IoT insurance market is valued at $52.78 billion in 2025 and will exceed $200 billion by 2030. The best insurance analytics software solutions increasingly integrate telematics, smart home sensors, and industrial monitors for risk assessment and dynamic pricing. Streaming data enables improved underwriting accuracy, reduced incident frequency, and faster claims processing.
Advanced Predictive Modeling
Cyber insurance plays a key role in predictive modeling. According to Munich Re estimates, the cyber insurance market stands at approximately $16.3 billion in 2025, and its steady growth intensifies the need for AI-based models. Predictive analytics insurance software integrates machine learning for attack simulations, anomaly analysis, and vulnerability assessments, which improves forecasting accuracy and reduces risk evaluation time.
Ethical AI and Regulation
Regulatory pressure in the AI sphere is intensifying. Over 100 bills are currently under consideration in the US aimed at controlling algorithm transparency and protecting customer rights. States like New York and Colorado have already introduced requirements for model audits, non-discrimination testing, and restrictions on using certain external data. SAS research shows that 59% of insurance professionals are concerned about ethical risks of GenAI, driving the growing popularity of Explainable AI, model audits, and human-in-the-loop approaches.
Blockchain and Fraud Prevention
Blockchain strengthens transparency and reduces fraud levels. Commercial insurance analytics software increasingly applies blockchain technology in parametric insurance, where smart contracts automatically execute payouts after defined triggers occur, such as weather events. Distributed ledgers ensure accurate transaction tracking, simplify duplicate claim detection, and create transparent audit trails for regulators.
Conclusion
The numbers tell a clear story. Insurance fraud costs the industry over $40 billion annually in the US alone. Claims processing that takes days could take minutes. Underwriters spend hours on risk assessments that algorithms handle in seconds. Meanwhile, customers expect Amazon-level personalization and instant responses.
Understanding what insurance analytics software can deliver is the first step toward transformation. Analytics platforms address all of this, but implementation isn’t simple. You need to choose between building custom solutions, buying off-the-shelf platforms, or combining both approaches. Each path has trade-offs in cost, time, and strategic control. What works for a regional auto insurer won’t work for a multinational health insurance provider, which is why the best insurance analytics software is often purpose-built.
Need help figuring out where to start? We’ve built custom analytics solutions for insurers across property, casualty, life, and health segments. Whether you need a full platform or specific modules integrated with your existing systems, we can map out an approach that fits your budget and timeline. Let’s talk about what makes sense for your business.
Have questions?
- Fraud detection shows results within weeks. You’ll start catching suspicious claims that manual review would miss. Claims automation takes 3-4 months because teams need to adapt workflows and build trust in the system. Underwriting improvements are slower, typically 12-18 months, because you need enough policy data to prove new risk models actually reduce losses better than old methods.
- Yes, but expect complications. The technical integration is usually manageable through middleware and APIs. The real problem is data quality. Legacy systems have inconsistent formats, critical info buried in text notes, and undocumented business logic. Budget 4-6 months for data cleanup and integration. Some companies run analytics separately at first, manually bridging gaps, then tackle full integration once they’ve proven value.
- BI tools show what happened. Insurance claims analytics software explains why, predicts what’s next, and recommends actions. Tableau graphs your loss ratios. An insurance platform tells you losses spiked from hail damage in specific zip codes, predicts similar weather next month, identifies underpriced policies in that area, and calculates premium adjustments. The difference is insurance-specific models and domain expertise built into the algorithms.
- Modern platforms have self-service interfaces where underwriters and adjusters directly access relevant insights without technical expertise. An adjuster sees a fraud score with plain-English explanations, not raw model outputs. That said, you need at least one technical person overseeing model performance, handling exceptions, and updating algorithms. Most mid-size insurers manage with one analytics engineer plus trained business users.
Don't want to miss anything?
Subscribe and get stories like these right into your inbox.
Keep reading

A Guide to Doctor Appointment App Development
Build an app to make doctor appointment booking simple. Explore features, tech, and strategies to deliver better healthcare access anytime, anywhere.

P2P and B2B Real-Time Payments: Benefits for Businesses
Real-time payments are revolutionizing B2B, P2P, and cross-border transactions. Read our article to explore how you can benefit from these technologies.

How to Build a Real Estate Marketplace in 2025
Thinking about launching a software product for the real estate industry? Find out how to create a real estate marketplace that will win the hearts of users.
Contact us
Let's explore how our expertise can help you achieve your goals! Drop us a line, and we'll get back to you shortly.